StatCenter Risk analysis: Difference between revisions
No edit summary |
|||
| Line 37: | Line 37: | ||
The MAE is the [https://www.tradingheroes.com/mfe-mae-explained/ Maximum Adverse Excursion]. | The MAE is the [https://www.tradingheroes.com/mfe-mae-explained/ Maximum Adverse Excursion]. | ||
<br>The MFE is the [https://www.tradingheroes.com/mfe-mae-explained/ Maximum Favorable Excursion]. | <br>The MFE is the [https://www.tradingheroes.com/mfe-mae-explained/ Maximum Favorable Excursion]. | ||
The MAE and MFE ratios are useful to analyse the potential of the trading strategy. By displaying the MAE/MFE ratios related to the Pips and the Growth, the trader can see if it’s better to let run some positions or to cut the losses quickly. | <br>The MAE and MFE ratios are useful to analyse the potential of the trading strategy. By displaying the MAE/MFE ratios related to the Pips and the Growth, the trader can see if it’s better to let run some positions or to cut the losses quickly. | ||
Different charts can be displayed : | Different charts can be displayed : | ||
* <u>MAE/Growth</u> : the X-Axis represents the positions MAE in terms of percentage. Since the MAE is the adverse excursion, it will always be negative. The Y-Axis represents the positions growth in terms of percentage. | * <u>MAE/Growth</u> : the X-Axis represents the positions MAE in terms of percentage. Since the MAE is the adverse excursion, it will always be negative. The Y-Axis represents the positions growth in terms of percentage. | ||
Revision as of 15:26, 23 March 2022
Summary
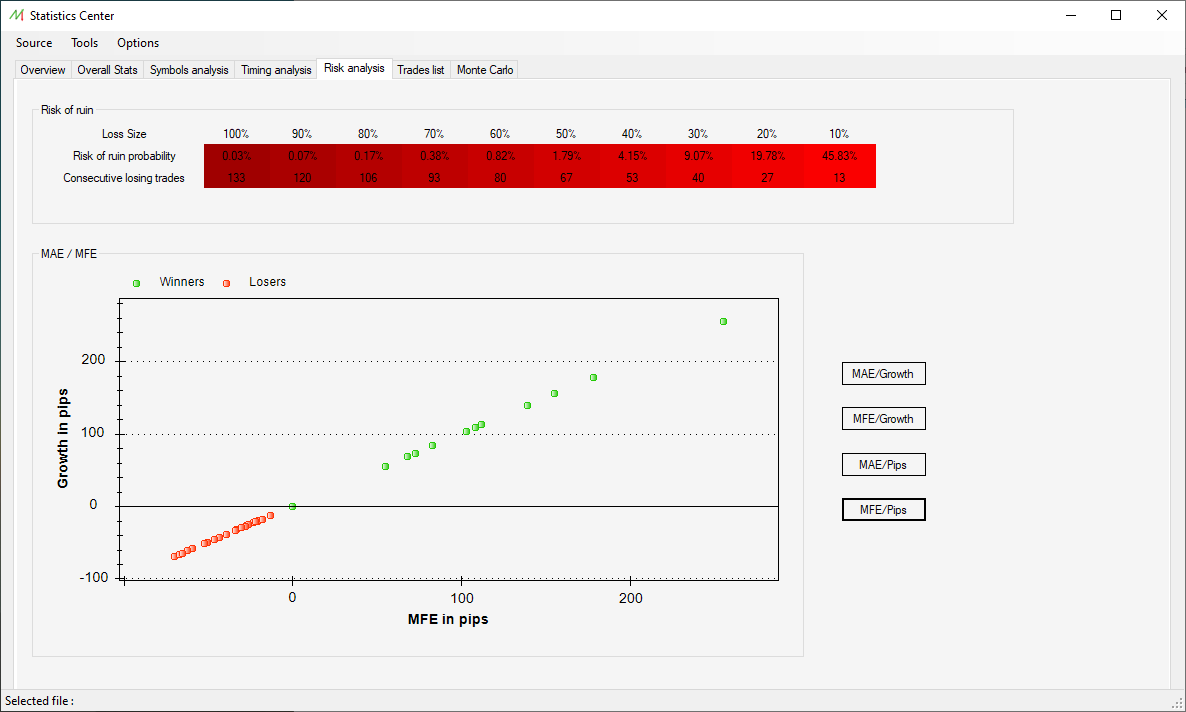
The Risk analysis pane is aimed to provide important information on the reliability of the trading system.
This allows to assess the risk of ruin and identify the different levels of drawdowns prone to happen during the trading system lifetime.

Risk of ruin
This array depicts each drawdown level with the occuring probability and the number of losing trades needed to reach this level.
MAE/MFE charts
The MAE is the Maximum Adverse Excursion.
The MFE is the Maximum Favorable Excursion.
The MAE and MFE ratios are useful to analyse the potential of the trading strategy. By displaying the MAE/MFE ratios related to the Pips and the Growth, the trader can see if it’s better to let run some positions or to cut the losses quickly.
Different charts can be displayed :
- MAE/Growth : the X-Axis represents the positions MAE in terms of percentage. Since the MAE is the adverse excursion, it will always be negative. The Y-Axis represents the positions growth in terms of percentage.
- MFE/Growth : the X-Axis represents the positions MFE in terms of percentage. Since the MAE is the favorable excursion, it will always be positive. The Y-Axis represents the positions growth in terms of percentage.
- MAE/Pips : the X-Axis represents the positions MAE in terms of percentage. Since the MAE is the adverse excursion, it will always be negative. The Y-Axis represents the positions amount of pips.
- MFE/Pips : the X-Axis represents the positions MFE in terms of percentage. Since the MAE is the favorable excursion, it will always be positive. The Y-Axis represents the positions amount of pips.
For each of these charts, the user can hover the mouse cursor on the dots to display, the X value, the Y value, and the Ticket position number.