StatCenter Overview: Difference between revisions
Jump to navigation
Jump to search
No edit summary |
No edit summary |
||
| Line 41: | Line 41: | ||
=== Dashboard === | === Dashboard === | ||
==== Dashboard data ==== | ==== Dashboard data ==== | ||
Here is the list of information available on this pane : | |||
* <u>Growth</u> : | |||
* <u>Abs. growth</u> : | |||
* <u>Deposit</u> : | |||
* <u>Profit/u> : | |||
* <u>Max losing streak</u> : | |||
* <u>Balance</u> : | |||
* <u>Trades</u> : | |||
* <u>Expectancy</u> : | |||
* <u>Winratio</u> : | |||
* <u>Profit factor</u> : | |||
* <u>Max drawdown</u> : | |||
==== Dashboard chart ==== | ==== Dashboard chart ==== | ||
Revision as of 11:37, 22 March 2022
Summary
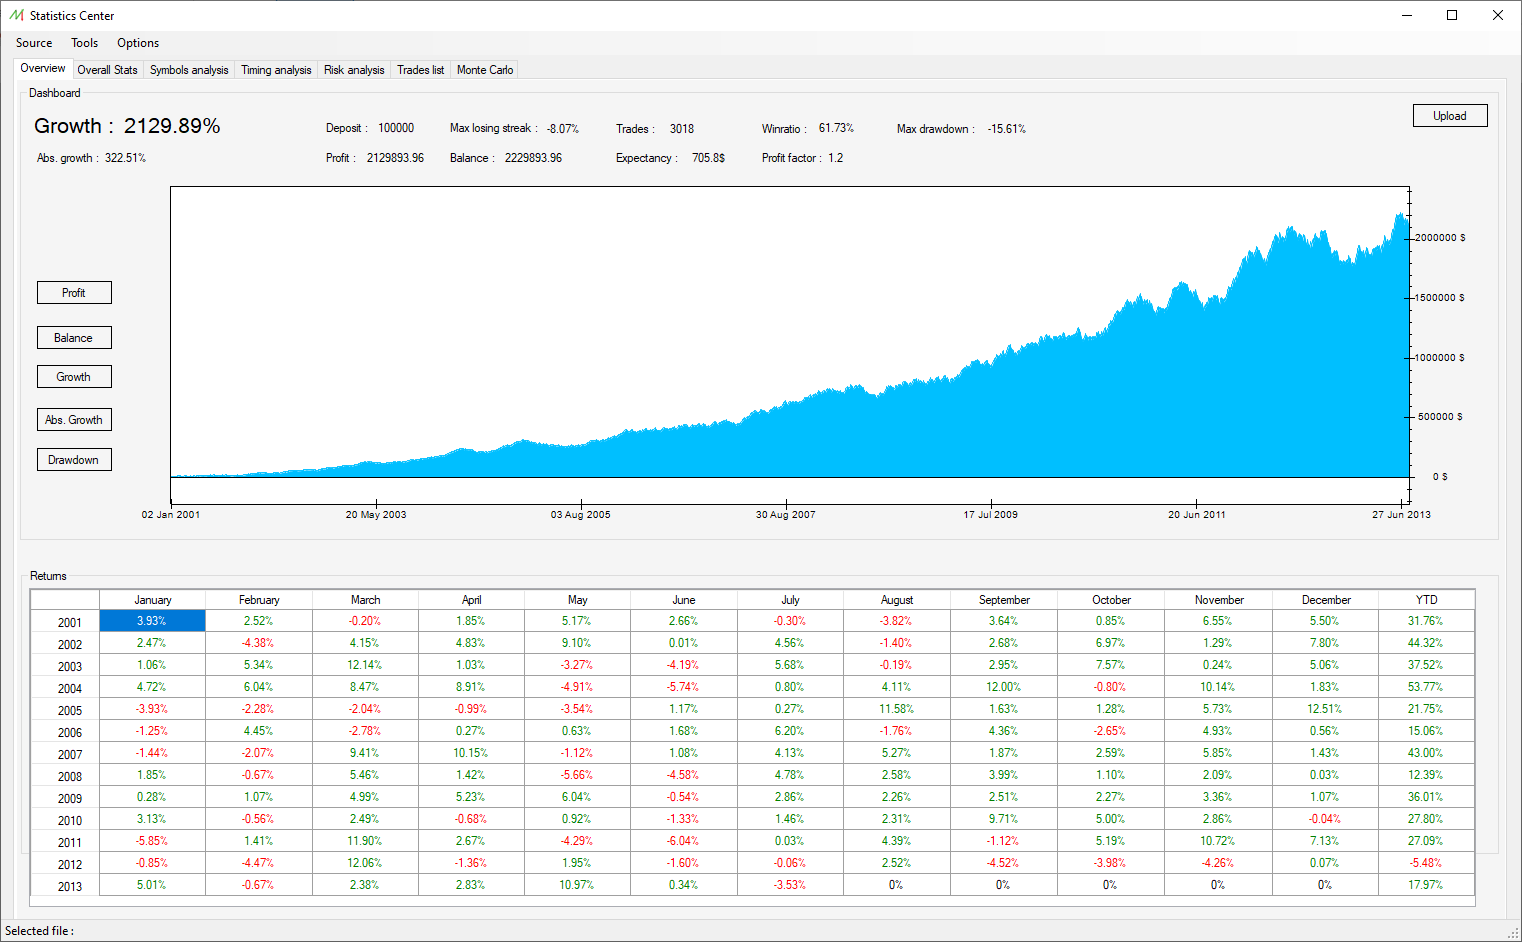
The Overview pane is aimed to provide the main information to quickly evaluate the potential of a trading system.
The most important data, statistics and the performance over the time are displayed in this module.

Dashboard
Dashboard data
Here is the list of information available on this pane :
- Growth :
- Abs. growth :
- Deposit :
- Profit/u> :
- Max losing streak :
- Balance :
- Trades :
- Expectancy :
- Winratio :
- Profit factor :
- Max drawdown :