Chart interface: Difference between revisions
Jump to navigation
Jump to search
No edit summary |
|||
| Line 1: | Line 1: | ||
=== Overview === | === Overview === | ||
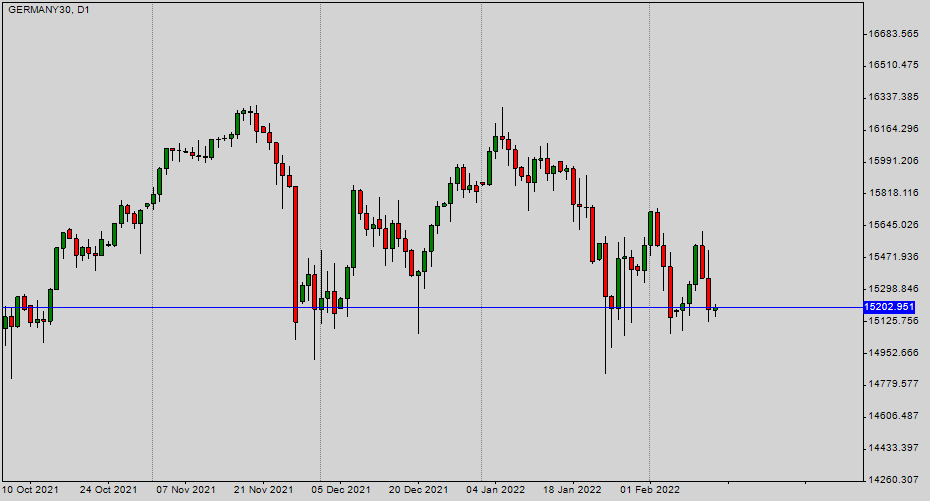
The chart interface shows the price value related to the time. This is the interface where the user can customize the appearance and set markets orders. | The chart interface shows the price value related to the time. This is the interface where the user can customize the appearance and set markets orders. | ||
[[File:ChartInterface.png|frameless|left]] | [[File:ChartInterface.png|frameless|left|upright=2.0]] | ||
<br> | <br> | ||
<br> | <br> | ||
| Line 14: | Line 14: | ||
<br> | <br> | ||
<br> | <br> | ||
=== Graphical objects location === | === Graphical objects location === | ||
The most used Graphical objects are located directly in the [[Main_interface_Toolbars|toolbar]] of the [[Main interface|main interface]]. | The most used Graphical objects are located directly in the [[Main_interface_Toolbars|toolbar]] of the [[Main interface|main interface]]. | ||
Revision as of 10:34, 29 March 2022
Overview
The chart interface shows the price value related to the time. This is the interface where the user can customize the appearance and set markets orders.

Graphical objects location
The most used Graphical objects are located directly in the toolbar of the main interface.
The other Graphical objects are located in the "Insert" menu.