Chart properties: Difference between revisions
Jump to navigation
Jump to search
No edit summary |
No edit summary |
||
| (2 intermediate revisions by the same user not shown) | |||
| Line 77: | Line 77: | ||
* <u>Show grid</u> : displays the background grid. | * <u>Show grid</u> : displays the background grid. | ||
* <u>Show Ask level</u> : displays the Ask level of the related symbol on the chart. | * <u>Show Ask level</u> : displays the Ask level of the related symbol on the chart. | ||
* <u>Show closed orders on charts</u> : displays the circles/labels of closed orders on charts. | |||
* <u>Show news events</u> : displays the [[News events|news]] on the charts. | |||
<br> | <br> | ||
Latest revision as of 10:34, 5 August 2022
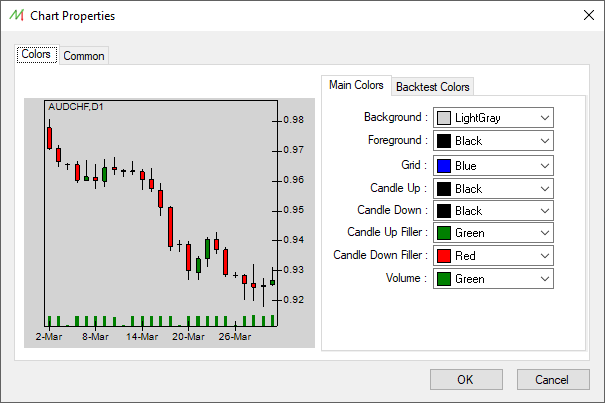
Chart colors

The following colors can be customized :
- Background : the background color of the chart.
- Foreground : the color of the X-Axis, Y-Axis and the title of the chart.
- Grid : the grid color.
- Candle Up : the outer color for bullish candles.
- Candle Down : the outer color for bearish candles.
- Candle Up Filler : the inner color for bullish candles.
- Candle Down Filler : the inner color for bearish candles.
- Volume : the volume color.

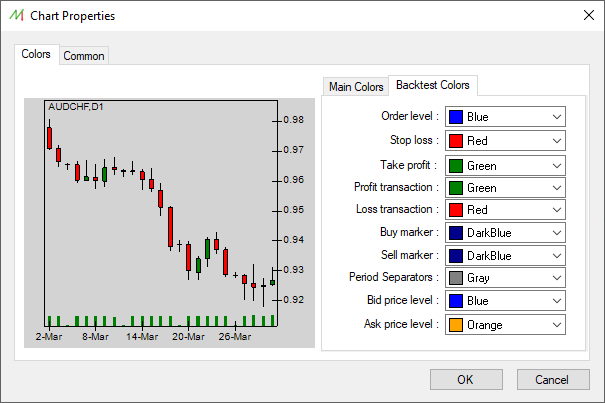
The following colors can be customized :
- Order level : the color of the execution price of a pending order.
- Stop loss : the Stop loss color for market orders.
- Take profit : the Take profit color for market orders.
- Profit transaction : The color of the closed order when it is in profit.
- Loss transaction : The color of the closed order when it is in loss.
- Buy marker : the label color for Buy orders once opened.
- Sell marker : the label color for Sell orders once opened.
- Period separators : the color of the period separators.
- Bid price level : the color of the Bid price level. This is the default price level displayed.
- Ask price level : the color of the Ask price level. This price level can be displayed if activated in the optional parameters.
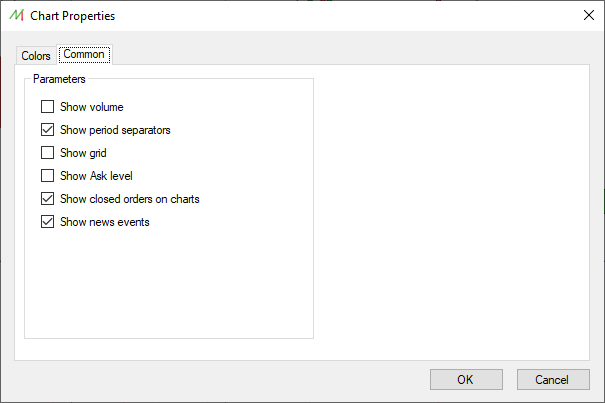
Optional parameters

The following options can be activated :
- Show volume : displays the volume of the related symbol on the chart.
- Show period separators : displays the period separators.
- Show grid : displays the background grid.
- Show Ask level : displays the Ask level of the related symbol on the chart.
- Show closed orders on charts : displays the circles/labels of closed orders on charts.
- Show news events : displays the news on the charts.